
Back before we were on lockdown and quarantine was part of our daily vocabulary, the PitchAI team had a trip to Phoenix during the MLB’s Cactus League Spring Training. While there have definitely been tougher business trips to take (like, Boston in February), this one was packed with lots of meetings, and one main goal – to get as much video data on elite pitchers as we possibly could.
PitchAI lets us use any camera to get a 3D biomechanics assessment of pitchers – whether they’re throwing a simulated game, in a bullpen, or in this case, if they’re getting ready for the MLB season by pitching in spring training games. With any biomechanics assessment – the numbers you receive only make sense if they’re provided in context! Part of the goal of our trip, was start building a database so pitchers of all ages could see how they compare against the pros.
So, how did things work out? The first stop was in Tempe, to check out the Angels as they took on the Royals. Personally, I am about as big of a fan of Shohei Ohtani as you will find, so it was awesome to see him in person (even if he wasn’t ready to pitch yet). Part of this was refining what some of the challenges for in game video would be – and one thing I learned is that when you’re filming in Arizona – you better hope you can find some shade! We captured some great data of Cam Bedrosian, Jesse Hahn, but maybe the most impressive was Mike Mayers. He had some great stuff and the velocity was definitely there for early in the game.
After that, it was off to Peoria to see one of the more exciting pitchers of the trip – The Texas Rangers’ Cy Young winner Corey Kluber, as he took on Zach Davies with the San Diego Padres. What was interesting for this game, was that it was at night – so some ISO adjustments had to be made to the Sony RX100VI camera. While Kluber and Davies looked sharp, it was also exciting to see some other MLB mainstays – Luis Perdomo was on, Drew Pomeranz got in some work, and the Rangers Nick Goody and Jose LeClerc showed off very exciting arms. These games were great, because there weren’t too many people in attendance, and we could get right down to field level and use the edge of the field as our tripod – just had to watch out for foul balls!
Phoenix is a cool spot for Spring Training, because unlike Florida, you can get to any stadium within an hour. The challenge there? Everything is exactly 55 minutes away. We were able to see a lot of great games, and collect video of MLB veterans like Craig Kimbrel, Pedro Strop, Sonny Gray, and Junior Guerra. We were also able to see some exciting young players like Jon Duplantier and Noe Ramirez.
In addition to getting video of all of these high level arms, we also wanted to see things like, how much of an impact did camera angle make on our evaluation? If you can’t get right to third base, how much of a difference would it make if you were in the dug out? Furthermore, say you’re scouting a game and you are in the upper deck of a spring training facility – would that make a difference?
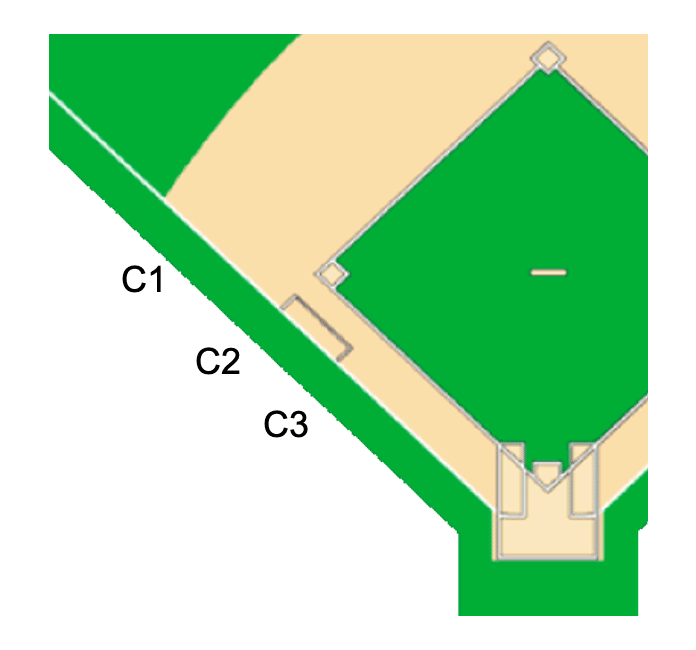
While attending a minor league camp, I filmed a pitcher throwing off of the mound during a simulated game – I captured 5 pitches from directly beside the team’s open side camera at third base, them moved 15 feet closer to home, and then finally captured 5 more pitches 30 feet further towards home than when I started. I figured, this would represent a pretty good spread to see if we could confuse the PitchAI cameras into giving us different results. While we do capture many different metrics (15 in total), for the sake of this evaluation I’m only reporting on Hip to Shoulder separation, and the throwing shoulder’s external rotation and abduction.
What did we end up with?
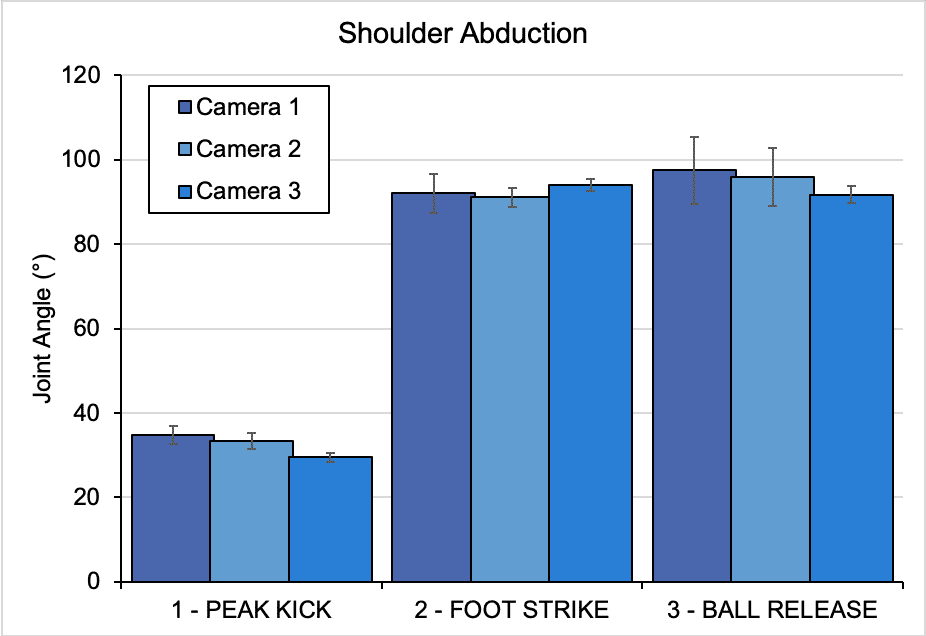
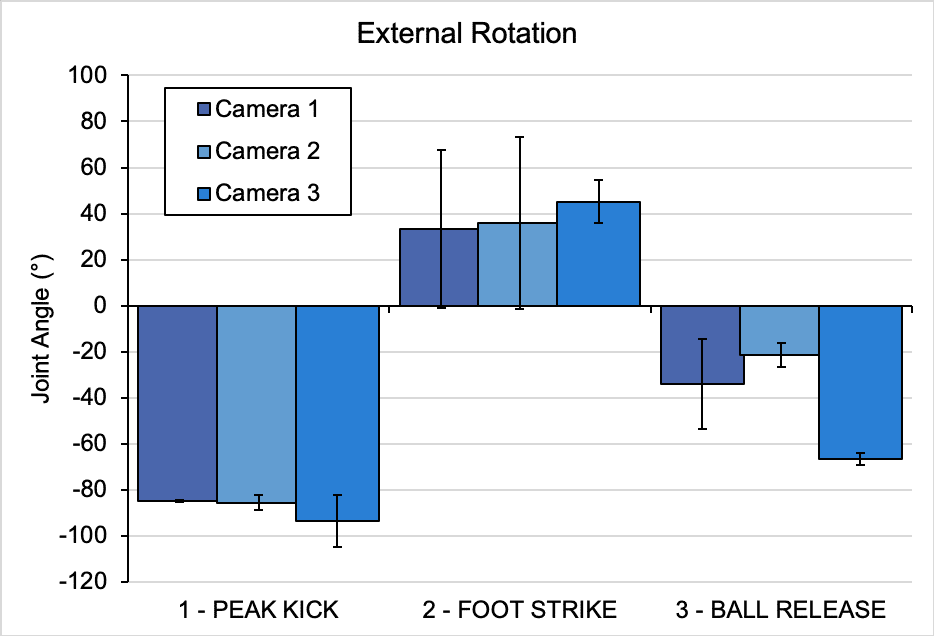
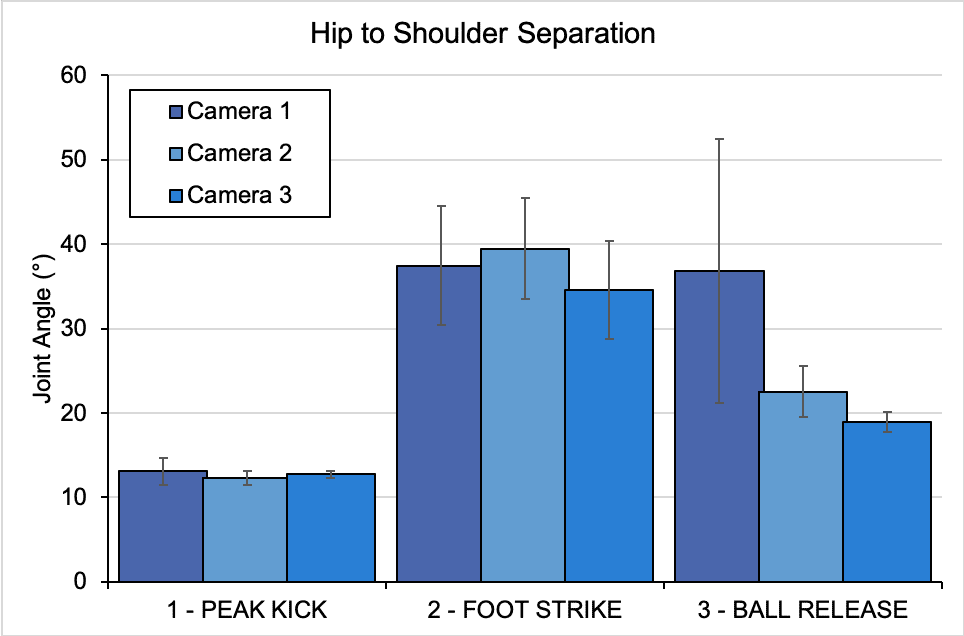
The camera angle remained fairly consistent for the shoulder abduction, and hip to shoulder metrics. External rotation had the highest amount of variability, but comparable in average value at the instant of foot strike. Typically, the angular metrics appeared a bit greater (like the hip to shoulder separation) on the purely oblique angle.
| External Rotation | Shoulder Abduction | Hip to Shoulder Separation | |||||||
| C1 | C2 | C3 | C1 | C2 | C3 | C1 | C2 | C3 | |
| Peak Kick | -84.8 ± 0.5 | -85.7 ± 5.7 | -93.6 ± 19.4 | 34.8 ± 3.7 | 33.4 ± 3.3 | 29.6 ± 1.9 | 13.1 ± 2.7 | 12.3 ± 1.4 | 12.7 ± 0.6 |
| Foot Strike | 33.4 ± 59.5 | 35.8 ± 64.7 | 45.2 ± 16 | 92 ± 8 | 91.1 ± 4 | 94.1 ± 2.4 | 37.5 ± 12.2 | 39.5 ± 10.4 | 34.5 ± 10.1 |
| Ball Release | -34.2 ± 33.8 | -21.3 ± 9.2 | -66.7 ± 4.4 | 97.5 ± 13.9 | 95.9 ± 12 | 91.7 ± 3.4 | 36.8 ± 27.1 | 22.5 ± 5.2 | 18.9 ± 2.1 |
However looking at average values throughout the full pitch, you can see there are some relatively strong relationships between the camera angles.
Average (SE) values for three camera angles (taken directly at third base (C1), then 15 feet further towards home plate (C2), and finally 30 feet closer to home plate (C3).
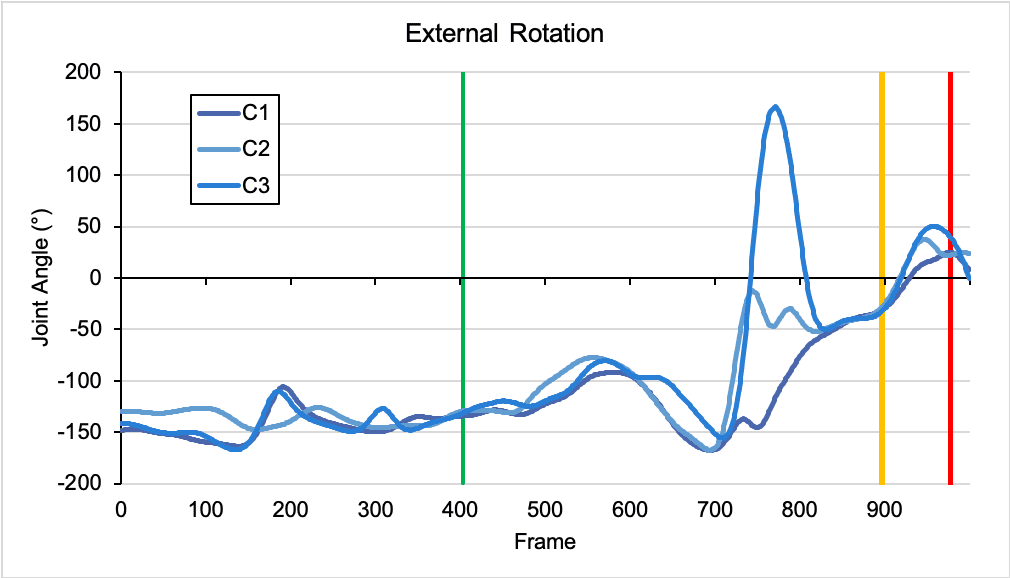
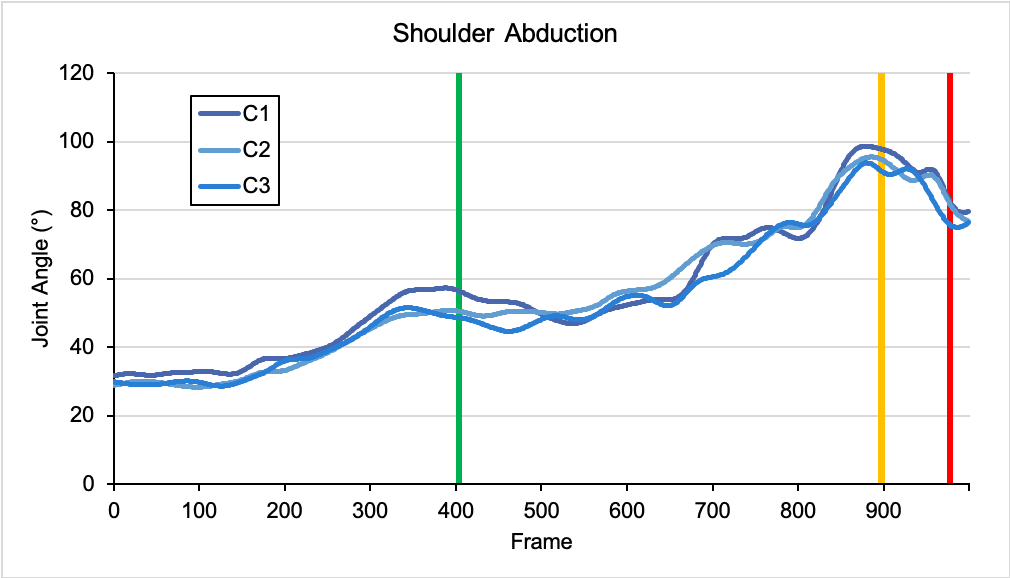
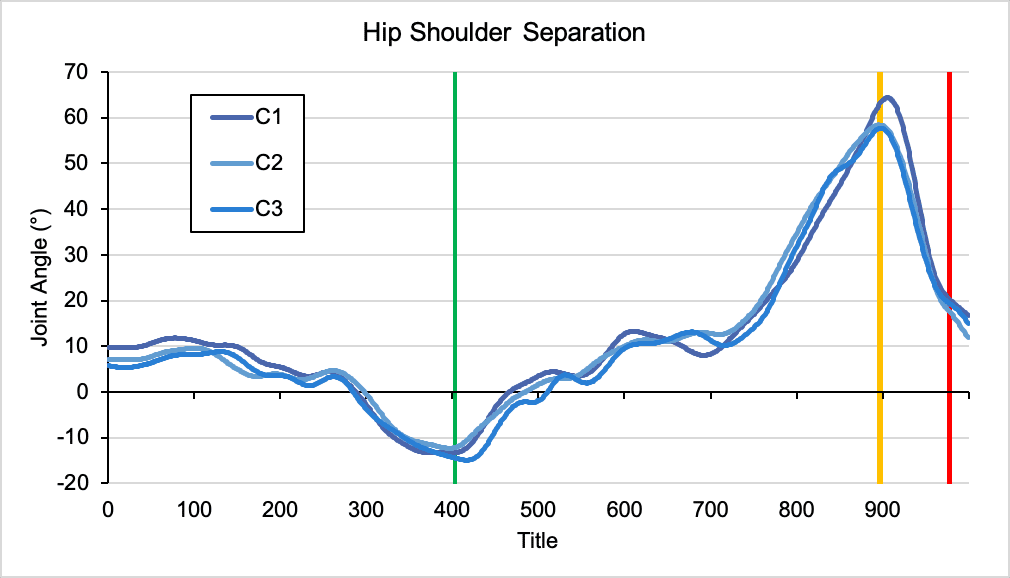
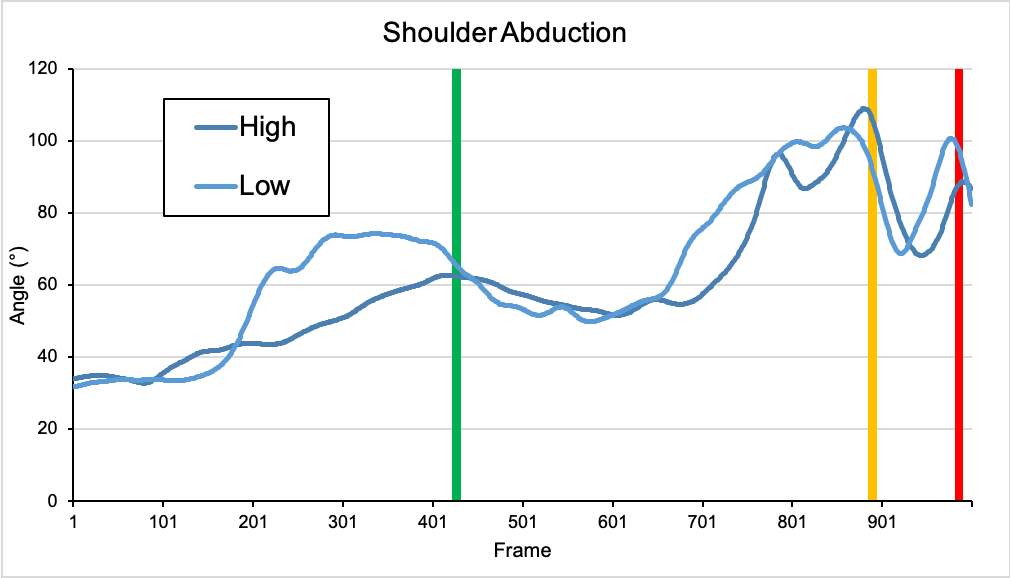
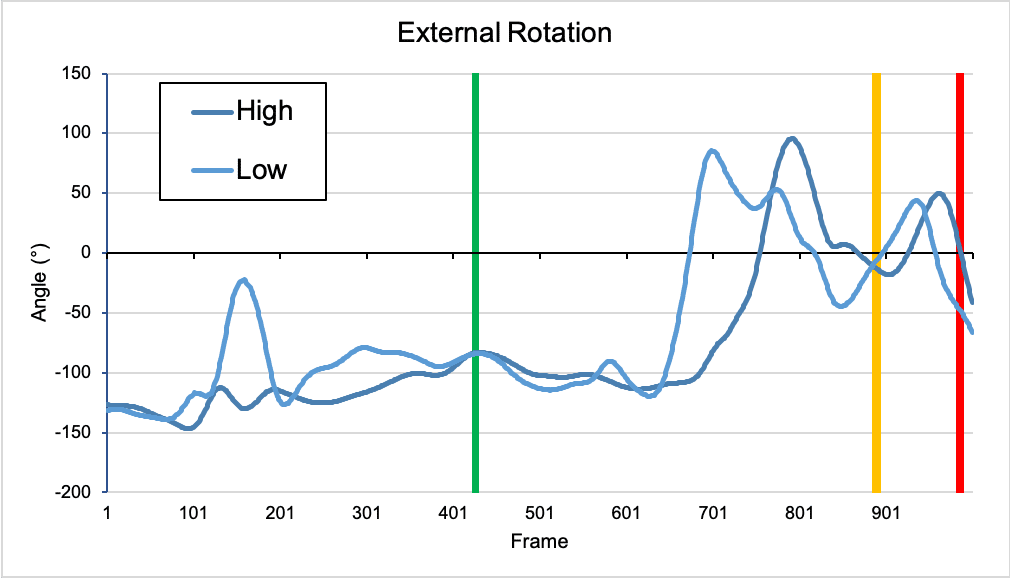
Full signal analysis for throwing arm external rotation, abduction, and hip to shoulder separation. Video was taken directly at third base (C1), then 15 feet further towards home plate (C2), and finally 30 feet closer (C3) to home plate. Green is the peak kick, yellow the foot strike, and red the ball release.
The camera angle remained fairly consistent for the shoulder abduction, and hip to shoulder metrics. External rotation had the highest amount of variability, but comparable in average value at the instant of foot strike. Typically, the angular metrics appeared a bit greater (like the hip to shoulder separation) on the purely oblique angle.
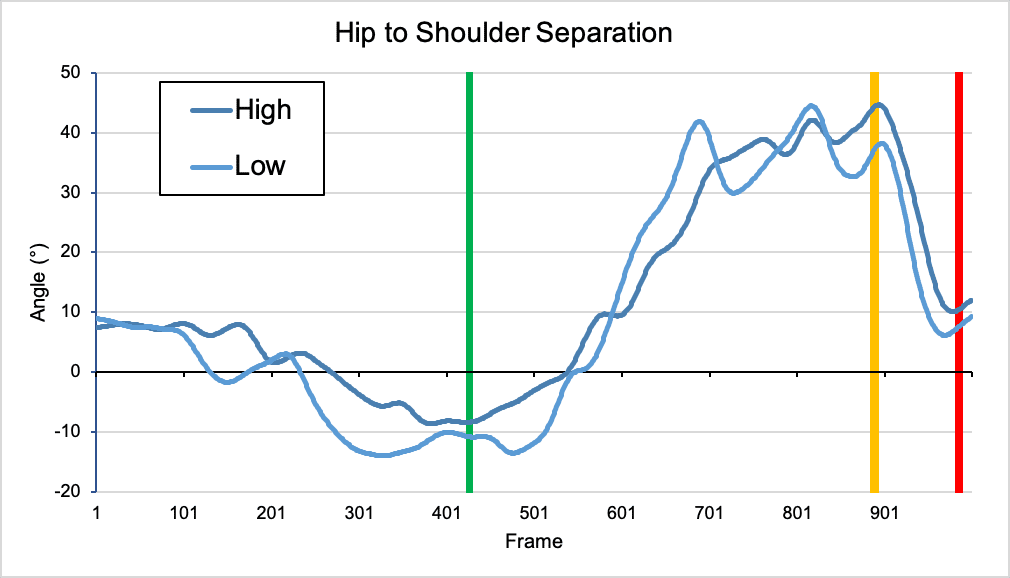
Additionally, while watching Sonny Gray and the Reds take on the Royals, I was able to get some footage from right next to the dugout on the third base side, and then capture a few more pitches from Sonny from the same spot but in the upper deck. Thanks to the zoom on the Sony RX100 VI, I was still able to get a good close up shot! In this case, we saw some pretty similar results (Table 2)
| Hip to Shoulder Separation | External Rotation | Abduction | ||||
| High | Low | High | Low | High | Low | |
| Peak Kick | -7 ± 4.4 | -11.2 ± 8.7 | -88.1 ± 19.9 | -87.7 ± 47.1 | 61.2 ± 1.5 | 70.5 ± 10.4 |
| Foot Strike | 41.8 ± 4 | 44.6 ± 2.1 | -17.5 ± 11.5 | -12 ± 7.7 | 90.2 ± 15 | 98.4 ± 8.5 |
| Ball Release | 11.6 ± 0.5 | 6.7 ± 4.7 | -26.9 ± 9.5 | -44.1 ± 9.1 | 88.6 ± 6.3 | 96.5 ± 19.9 |
At the instant of foot strike and ball release, things were pretty consistent – similar average values, and relatively consistent standard deviations. External rotation was the one with the most variability – and this is because Sonny Gray hit us with a slide step which does complicate the analysis, but also gives us something to work on before heading to full market.
Over the course of the full signal, things do look very consistent.
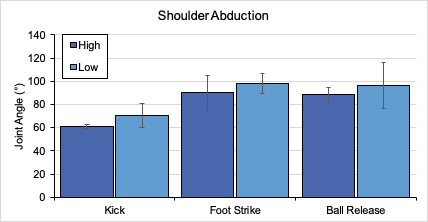
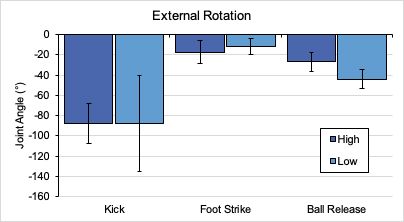
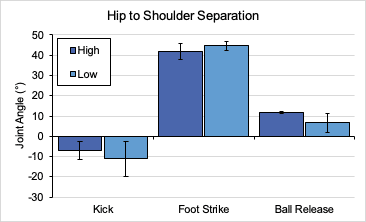
Kinematic metrics (mean and SD) recorded at field level (low), and from the upper deck (high) of a minor league stadium.
Kinematic metrics (mean and SD) recorded at field level (low), and from the upper deck (high) of a minor league stadium.
What is next? We need a lot more video! The goal with filming high level throwers, is that we can start building normalized databases, making it easier for you to compare your results against what happens at the highest level – but also to make sure that we are giving you for data is honest, accurate, and reliable.
So, for PitchAI version 1, the best bet is to try and be consistent with your camera angle – if you are trying to get a baseline evaluation from a player, and then to perform subsequent evaluations – get multiple pitches so you can take averages, but try and record from the same position. If you can’t – PitchAI will still give you results that deal with the parallax effect – but may more be about the timing than magnitudes of angles.
We created this best practices guide for capturing videos, those which you can upload when our PitchAI software is ready this summer!